


43 | Poverty & Development Issues
In this post cover the Topic of Poverty for #UPSC CSE

Poverty:
Definition: It is a multidimensional phenomenon in which a person or community lacks the financial resources and essentials for a minimum standard of living. It signifies that the income level from employment is so low that basic human needs can't be met.
In India, 21.9% of the population lives below the national poverty line in 2011.
In 2018, almost 8% of the world’s workers and their families lived on less than US$1.90 per person per day (international poverty line).
Types of Poverty:
Absolute poverty:
Also known as extreme poverty or abject poverty.
A condition where household income is below a necessary level to maintain basic living standards (food, shelter, housing).
Those who belong to absolute poverty tend to struggle to live and experience a lot of child deaths from preventable diseases.
first introduced in 1990, the “dollar a day” poverty line measured absolute poverty by the standards of the world’s poorest countries; which in 2015, was changed to $1.90 a day, by the World Bank.
Relative Poverty:
It is defined from the social perspective that is living standard compared to the economic standards of population living in surroundings.
It is a measure of income inequality.
Poverty Line
The conventional approach to measuring poverty is to specify a minimum expenditure (or income) required to purchase a basket of goods and services necessary to satisfy basic human needs. This minimum expenditure is called the poverty line.
The basket of goods and services necessary to satisfy basic human needs is the Poverty Line Basket (PLB).
The proportion of the population below the poverty line is called the poverty ratio or headcount ratio (HCR).
Societal Poverty Line : Introduced by the World Bank in 2018 to capture the relative aspect of poverty. The SPL is a hybrid line, combining the US$1.90-a-day absolute poverty line with a relative component that increases as median consumption or income in an economy rises.
The Global Multidimensional Poverty Index (MPI)
Developed in 2010 by Oxford Poverty and Human Development Initiative (OPHI) and the United Nations Development Programme (UNDP) for UNDP’s Human Development Reports.
1.3 billion people (22%) are identified by the global MPI as multidimensionally poor as per the Global Multidimensional Poverty Index 2020.
3 Dimensions and 10 Indicators in MPI

The MPI assesses poverty at the individual level.
If a person is deprived in a third or more of ten (weighted) indicators, the global MPI identifies them as ‘MPI poor’.
The extent – or intensity – of their poverty is also measured through the percentage of deprivations they are experiencing.
How poverty is measured
The poverty in India is measured on the basis of poverty line quantified in terms of per capita consumption expenditure
Data is obtained from the large sample survey of consumer expenditure data of the National Sample Survey Office (NSSO).
Households with consumption expenditures below the poverty line are said to be “Below the Poverty Line (BPL)” and deemed to be poor.
Poverty Estimation in India
Pre-independence poverty estimates
Post-independence poverty estimates
Pre-Independence Poverty Estimation
Poverty and Unbritish Rule in India (1901): Dadabhai Naoroji in his book made the earliest estimate of poverty line at 1867-68 prices (₹16 to ₹35 per capita per year) based on the cost of a subsistence diet.
National Planning Committee (1938): set up under the chairmanship of Jawaharlal Nehru suggested a poverty line (ranging from ₹15 to ₹20 per capita per month) based on a minimum standard of living.
The Bombay Plan (1944): Bombay Plan proponents suggested a poverty line of ₹75 per capita per year.
Post-independence poverty estimates
Working Group (1962): The poverty line in India was quantified for the first time in 1962 by this Group in terms of a minimum requirement (food and non-food) of individuals for healthy living.
VM Dandekar and N Rath (1971): first established the consumption levels required to meet a minimum calorie norm. (2250 calories per person per day). Poverty level was calculated on the basis of expenses needed to fulfil this calorie criteria.
Task Force on “Projections of Minimum Needs and Effective Consumption Demand” headed by Dr. Y. K. Alagh (1979): Official poverty counts began for the first time in India based on the approach of this Task Force. Poverty line was defined as the per capita consumption expenditure level to meet average per capita daily calorie requirement of 2400 kcal per capita per day in rural areas and 2100 kcal per capita per day in urban areas.
D. T. Lakdawala Committee (1993): It extended these poverty lines to states and over time allowing official poverty counts over time and in the states.
Tendulkar Expert Group (2009): It recommended -
Shift from Calorie Consumption based Poverty Estimation : It based its calculations on the consumption of the items like cereal, pulses, milk, edible oil, vegetables, entertainment, personal & toilet goods.
Uniform Poverty line Basket: Unlike Alagh committee (which relied on separate PLB for rural and urban areas), Tendulkar Committee computed new poverty lines for rural and urban areas of each state based on the uniform poverty line basket and found that all India poverty line (2004-05).
Private Expenditure: Incorporation of private expenditure on health and education while estimating poverty.
Price Adjustment Procedure: The Committee also recommended a new method of updating poverty lines, adjusting for changes in prices and patterns of consumption.
Mixed Reference Period: The Committee recommended using Mixed Reference Period based estimates, as opposed to Uniform Reference Period based estimates.
Rangrajan Committee (2014) : Due to widespread criticism of Tendulkar Committee approach as well as due to changing times and aspirations of people of India, Rangarajan Committee was set up in 2012.
Committee recommended raising further both the rural and urban poverty lines. This committee recommended poverty line at monthly per capita consumption expenditure of Rs. 972 in rural areas and Rs. 1407 in urban areas. The decision is yet to be taken on the Rangarajan Committee recommendations.
Therefore, the Tendulkar poverty line remains the official poverty line and is the basis of the current official poverty estimates in 1993-94, 2004-05 and 2011-12.
Note: As per the Tendulkar estimation, the percentage of people living below the poverty line in India is 21.9%. However, as pe Rangarajan estimation, the percentage of people living below the poverty line in India is 29.5%.
Arvind Panagariya Task Force (2015) : The task force suggested setting up of committee to identify people “Below Poverty Line (BPL)” It also suggested participation of states. The paper talks of considering four options for tracking the poor-
First, continue with the Tendulkar poverty line.
Second, switch to the Rangarajan or other higher rural and urban poverty lines.
Third, bottom 30% of the population tracking over time
Fourth, tracking the bottom 30% on specific components, such as housing, sanitation, electricity, nutritional intake, etc.
NITI Aayog Task Force : NITI Aayog favoured the Tendulkar line (21.9%).
SECC data as suggested by Saxena and Hashim committee will be used for entitlements.
Dr. N.C. Saxena Committee was set up by the Ministry of Rural Development to advise it on the suitable methodology for BPL Census and not for estimation of poverty.
Poverty Estimation by Dr Amartya Sen
His capability approach to understanding poverty goes beyond income and stresses the whole range of means, available to achieve human capabilities such as literacy, longevity and access to income.
Causes of Poverty in India
The Old Perspective: One view of poverty is that it is providential, and it is the result of an individuals.
The Modern Perspective: According to the modern view, poverty is beyond individual control, and it is the social system functioning which is the major cause of poverty.
Major causes:
Population Explosion
Low Agricultural Productivity
Inefficient Resource utilisation
Low Rate of Economic Development
Price Rise
Unemployment
Lack of Capital and Entrepreneurship
Social Factors
Colonial Exploitation
Climatic Factors
Natural calamities such as frequent floods, disasters, earthquake and cyclone
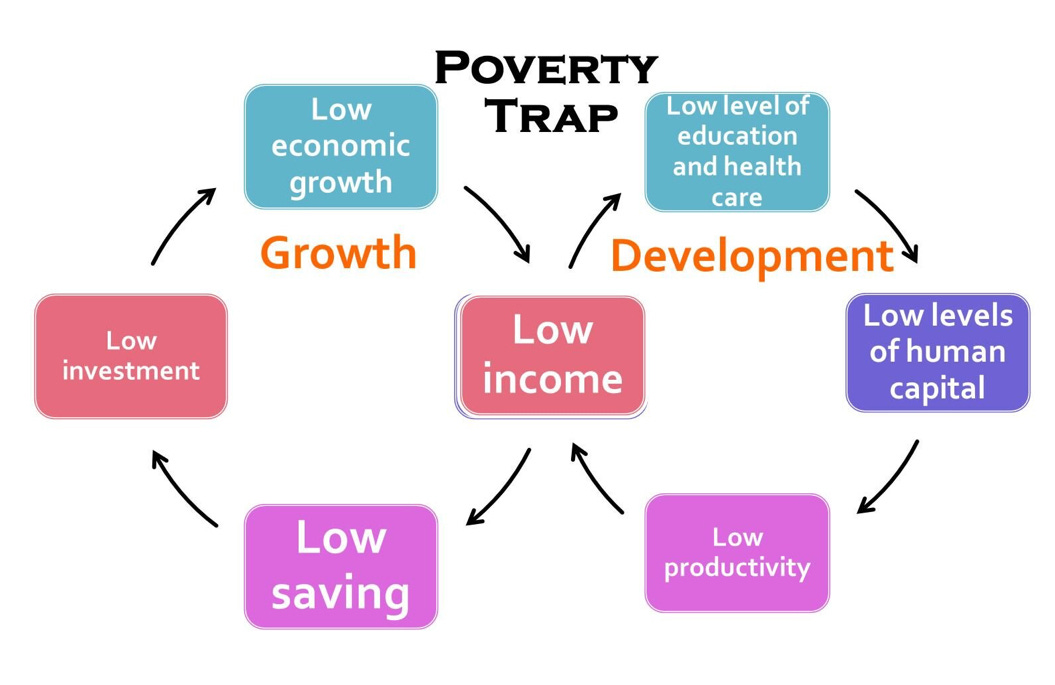
Poverty Trap:
Poverty trap is a spiraling mechanism which forces people to remain poor. It is so binding in itself that it doesn't allow the poor people to escape it. Poverty trap generally happens in developing and under-developing countries, and is caused by a lack of capital and credit to people.
Poverty alleviation programs in India
Employment programmes and skill-building
Jawahar Gram Samriddhi Yojana
Mahatma Gandhi National Rural Employment Guarantee Act (MGNREGA) 2005
National Rural Livelihood Mission: Ajeevika (2011)
National Urban Livelihood Mission
Pradhan Mantri Kaushal Vikas Yojana
Food and shelter
Food for Work Programme
Annapurna
Pradhan Mantri Awaas Yojana
Integrated Child Development Program
Midday Meal scheme
Access to credit
Pradhan Mantri Kisan Samman Nidhi
Pradhan Mantri Jan Dhan Yojana
Integrated Rural Development Programme (IRDP)
National Old Age Pension Scheme (NOAPS)
Challenges
Incidence of extreme poverty continues to be much higher in rural areas than in urban areas.
Despite rapid growth and development, an unacceptably high proportion of our population continues to suffer from severe and multidimensional deprivation.
While a large number of poverty alleviation programmes have been initiated, they function in silos.
The resources allocated to anti-poverty programmes are inadequate and there is a tacit understanding that targets will be curtailed according to fund availability.
There is no method to ensure that programmes reach everybody they are meant for.
Lack of proper implementation and right targeting
There has been a lot of overlapping of schemes.
Every year a huge number is added to the population pool of the country. This renders the scheme ineffective.
Way Forward
Accelerating rural poverty reduction: agricultural growth
Creating more and better jobs
Focusing on women and Scheduled Tribes : low participation of women in the labour market and the slow progress among scheduled tribes.
Improving human development outcomes for the poor : undernutrition and open defecation
Better health, sanitation and education
Conclusion
The Global Multidimensional Poverty Index-2018 released by the UN noted that 271 million people moved out of poverty between 2005-06 and 2015-16 in India. The poverty rate in the country has nearly halved, falling from 55% to 28% over the ten-year period. Still a big part of the population in india is living Below the Poverty Line.